

Image Details
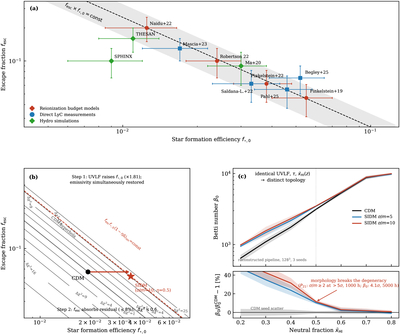
Caption: Figure 1.
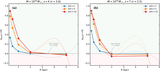
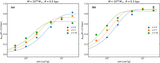
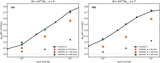
The escape fraction degeneracy: empirical evidence, mechanism, and resolution. (a) Published values of fesc and f⋆,0 from reionization studies (fesc here denotes population-averaged escape fractions, not the model normalization fesc,0). Budget models (red circles: S. L. Finkelstein et al. 2019; B. E. Robertson 2021; S. L. Finkelstein et al. 2022; R. P. Naidu et al. 2022), direct Ly measurements (blue squares: A. Saldana-Lopez et al. 2022; S. Mascia et al. 2023; R. Begley et al. 2025; A. J. Pahl et al. 2025), and simulations (green diamonds: X. Ma et al. 2020; J. Rosdahl et al. 2022; J. Y. C. Yeh et al. 2023). The dashed line shows fesc × f⋆,0 = (2.5 ± 0.8) × 10−3, the product required to match Planck τ under our fiducial CDM calibration ρUV ∝ f⋆,0 (Appendix C); what τ pins directly is fesc ξion ρUV, and published analyses adopting different faint-end limits and ξion scatter along, rather than across, the hyperbola. (b) Two-step optimizer trajectory: SIDM (σ/m = 10 cm2 g−1, η = 0.5) raises f⋆,0 by ∼81% to restore the observed UVLF (Step 1); the ionizing emissivity is simultaneously restored to within a few percent, and fesc absorbs the residual (Step 2), yielding Δχ2 ≤ 0.6 near the shifted hyperbola ﹩{f}_{{\rm{esc}}}\,{f}_{\star ,0}\,{\langle 1-\eta {{\rm{\Delta }}}_{{\rm{bind}}}\rangle }_{{\rm{ion}}}={\rm{const}}﹩. (c) Betti number β0 versus ﹩{\bar{x}}_{{\rm{HI}}}﹩ for CDM and two SIDM cross sections. The topology signal is structurally independent of fesc × f⋆,0; the morphological separation at ﹩{\bar{x}}_{{\rm{HI}}}=0.5﹩ is detectable through the 21 cm power spectrum at >5σ with 1000 hr per pointing of SKA1-Low for σ/m ≳ 2 cm2 g−1 and through a field-level β0 measurement at 2.0σ (σ/m = 10 cm2 g−1, 1000 hr), reaching 4.1σ at 5000h (σ/m = 5: 2.9σ) (Z. Wang 2026) (Appendix F). The plotted intrinsic ﹩{\beta }_{0}({\bar{x}}_{{\rm{HI}}})﹩ curves illustrate the morphological difference; the quoted field-level significances are obtained from a separate threshold-curve estimator at 2563 (Appendix F).
Other Images in This Article
Copyright and Terms & Conditions
© 2026. The Author(s). Published by the American Astronomical Society.

