

Image Details
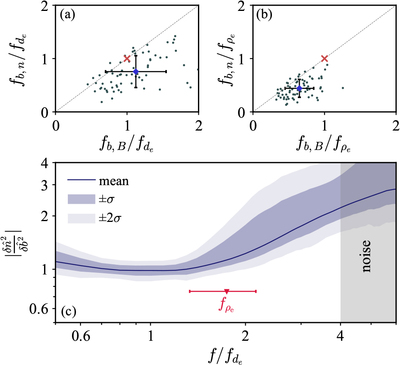
Caption: Figure 4.
Break frequencies fb,n and fb,B obtained from fits relative to (a) ﹩{f}_{{d}_{e}}﹩ and (b) ﹩{f}_{{\rho }_{e}}﹩. (c) Mean trend of the normalized n–B spectral ratio as a function of ﹩f/{f}_{{d}_{e}}﹩. Violet shaded regions indicate the standard deviation (σ) across the intervals. The mean ﹩{f}_{{\rho }_{e}}﹩ and its variation are shown by the red marker.
Other Images in This Article
Copyright and Terms & Conditions
© 2026. The Author(s). Published by the American Astronomical Society.

Copyright ©
2026 Astronomy Image Explorer. All Rights Reserved.
