

Image Details
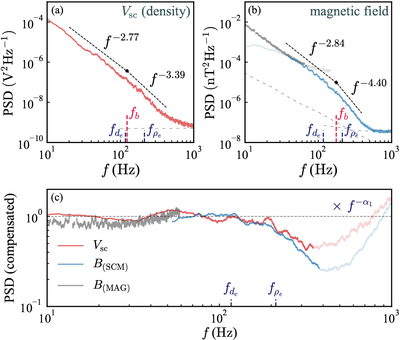
Caption: Figure 1.
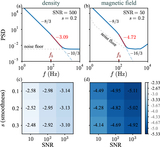
Power spectral density of (a) Vsc and (b) B (MAG—grey, SCM—blue). The least-squares fits (vertically shifted for clarity) and the break frequency (fb) using Equation (1) are shown by the black dashed lines and the diamond marker, respectively. Thin grey dashed lines indicate the flat analog-to-digital converter and the frequency dependent SCM noise floors. (c) Vsc and B spectra compensated by the sub-ion range scaling ﹩({f}^{-{\alpha }_{1}}P(f))﹩. The compensated spectra shown are faded for SNR ≲2.
Other Images in This Article
Copyright and Terms & Conditions
© 2026. The Author(s). Published by the American Astronomical Society.

Copyright ©
2026 Astronomy Image Explorer. All Rights Reserved.
