

Image Details
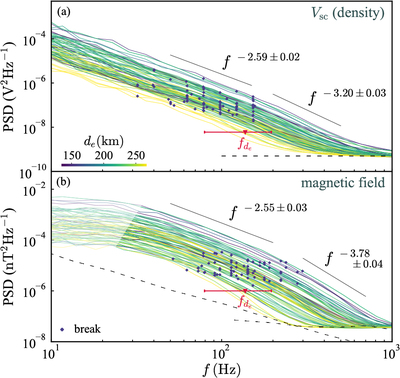
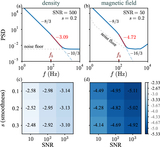
Caption: Figure 2.
(a) Vsc and (b) B spectra for all intervals smoothed using a variable-width running mean window. Average slopes at sub-ion and scales are shown. Blue diamonds mark the breaks obtained from fits. Mean ﹩{f}_{{d}_{e}}﹩ and its variation across the intervals are shown by the red marker.
Other Images in This Article
Copyright and Terms & Conditions
© 2026. The Author(s). Published by the American Astronomical Society.

Copyright ©
2026 Astronomy Image Explorer. All Rights Reserved.
