

Image Details
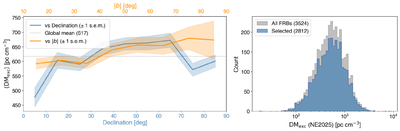
Caption: Figure 1.
Left: mean extragalactic DM (〈DMexc〉, NE2025 model) as a function of decl. (blue curve) and ∣b∣ (orange curve), in 10° bins. The shaded regions show the standard errors of the mean (s.e.m.) in each case. The horizontal dashed line marks the global mean (617 pc cm−3). Only marginal dependencies on decl. and ∣b∣ are observed, indicating that the sample is largely statistically homogeneous. Right: distribution of DMexc (NE2025) for all FRBs after quality-flag and repeater cuts, and the exclusion of events with negative DMexc (gray; N = 3492) and the final selected subsample (blue; N = 2812).
Other Images in This Article
Copyright and Terms & Conditions
© 2026. The Author(s). Published by the American Astronomical Society.

Copyright ©
2026 Astronomy Image Explorer. All Rights Reserved.
