

Image Details
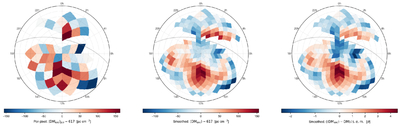
Caption: Figure 2.
North Celestial Pole–centered polar projections of extragalactic DM excess across the Northern Sky. R.A, increases clockwise; the gray curve marks the Galactic plane (b = 0°). Left: per-pixel mean DM excess (Nside = 4, NFRB ≥ 20 per pixel, 75 pixels). Middle: Gaussian-smoothed DM excess (Nside = 8, σ = 7﹩\mathop{.}\limits^{{\unicode{x000b0}}}﹩3). A prominent excess, which we term Wall 1, of ∼150 pc cm−3 is visible near α ≈ 12h, δ ≈ 55°. A secondary excess, termed Wall 2, is visible near α ≈ 2h, δ ≈ 45°. Right: significance of the smoothed DM excess in units of the standard error of the mean (s.e.m.). The peak exceeds 4σ for Wall 1. In all panels, the colorbar ranges are set by the minima and maxima of the data.
Other Images in This Article
Copyright and Terms & Conditions
© 2026. The Author(s). Published by the American Astronomical Society.

