

Image Details
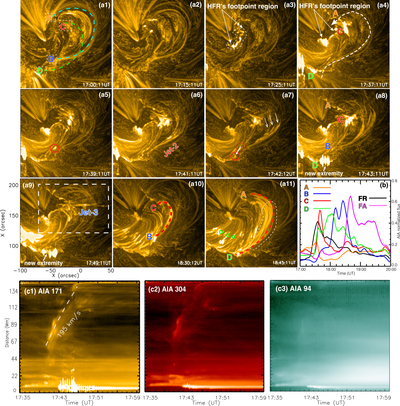
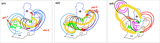
Caption: Figure 3.
(a1)–(a11) Onset of Jet-2 and the associated topology change of the coronal side arcades (colored dashed lines, including prejet side arcades: “AB” and “CD,” as well as postjet newborn flare arcades: “CB” and “AD”) observed in SDO/AIA 171 Å images enhanced by the multi-scale Gaussian normalization (MGN) code (H. Morgan & M. Druckmüller 2014). The paired white arrows in (a3) and (a4) mark the expanding northern footpoint brightening region of the HFR. Red solid/dashed circles in (a5) and (a7) represent the footpoint features of the coronal side arcades before and after drift, which participated in the launch of Jet-2. White arrows in (a7) indicate the embedded subjets within Jet-2. The white dashed rectangle in panel (a9) outlines the field of view (FOV) containing Jet-3, which is displayed in Figure 4. (b) Temporal evolution of the AIA 171 Å light curves integrated over the arcade footpoint regions ( “A,” “B,” “C,” and “D,” marked by white boxes in (a1)), the HFR footpoint region (FR; marked by white outline in (a3)), and the newborn side flare arcade region (FA; marked by white outline in (a11)), respectively. (c1)–(c3) Time–distance diagrams across multiple EUV channels, sliced along the Jet-2 trajectory (indicated by the white dashed arrow in a4). A 5.6 s animation utilizing AIA 171, 304, and 94 Å passbands displays reconnection Jet-2 and Jet-3 over 17:00:11–18:50:12 UT.
(An animation of this figure is available in the online article.)
(An animation of this figure is available.)
The video/animation of this figure is available in the online journal.
Other Images in This Article
Copyright and Terms & Conditions
© 2026. The Author(s). Published by the American Astronomical Society.

