

Image Details
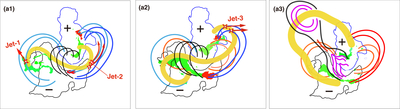
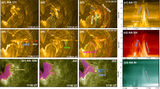
Caption: Figure 5.
Cartoons illustrate the onset of reconnection jets during different phases of the HFR eruption. Magnetic polarities (black and blue contours) and the associated flare ribbons (green-filled contours) are extracted from HMI line-of-sight (LOS) magnetograms and AIA 1600 Å observations, respectively. In the cartoon, the HFR is represented by the yellow channels, while standard postflare loops are denoted by purple curves. Prejet and postjet coronal side arcades are indicated by cyan/blue and orange/red curves, respectively.
Other Images in This Article
Copyright and Terms & Conditions
© 2026. The Author(s). Published by the American Astronomical Society.

Copyright ©
2026 Astronomy Image Explorer. All Rights Reserved.
