

Image Details
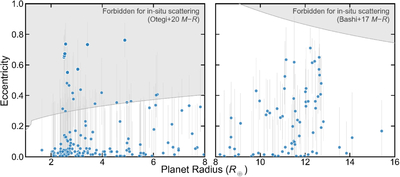
Caption: Figure 8.
Eccentricity–radius diagram for the planet sample. Points show the mode eccentricity, with errors drawn from 68% credible intervals. The curves indicate first-order scattering-based characteristic eccentricities, ﹩{e}_{{\rm{sc}}}=\sqrt{{\rm{\Theta }}}﹩, evaluated at fixed (a = 0.2) au and (M⋆ = 1M⊙), where (Θ = 2(a/Rp)(Mp/M⋆)). Two mass–radius assumptions bound the maximum eccentricity curve: the empirical J. F. Otegi et al. (2020) relation for planets below 120M⊕, which we cut off at our canonical sub-Saturn size, dashed line; and a Jupiter-like giant-planet scaling from D. Bashi et al. (2017), solid line. These composition-dependent curves provide illustrative upper-envelope expectations for eccentricities produced by planet–planet scattering.
Other Images in This Article
Show More
Copyright and Terms & Conditions
© 2026. The Author(s). Published by the American Astronomical Society.

