

Image Details
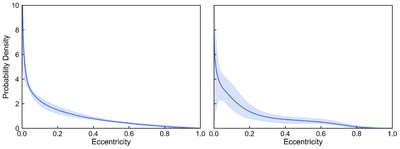
Caption: Figure 4.
Posterior eccentricity distribution for the full warm-single planet sample (1–16 R⊕) inferred with our hierarchical Bayesian framework. Left: Beta model. Right: two-component Beta mixture model. The solid blue curve shows the median posterior density as a function of eccentricity, and the shaded band indicates the 68% credible interval.
Other Images in This Article
Show More
Copyright and Terms & Conditions
© 2026. The Author(s). Published by the American Astronomical Society.

Copyright ©
2026 Astronomy Image Explorer. All Rights Reserved.
