

Image Details
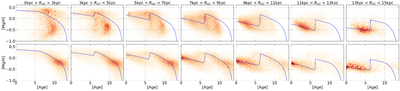
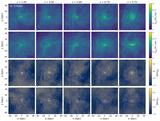
Caption: Figure 1.
Observed and predicted age–metallicity distribution as a function of radius. The top row displays the observed distribution derived from APOGEE data, while the bottom row shows the corresponding predictions from the late-accretion chemical evolution model. The solid blue lines in both rows illustrate the evolutionary tracks of the late-accretion models.
Other Images in This Article
Copyright and Terms & Conditions
© 2026. The Author(s). Published by the American Astronomical Society.

Copyright ©
2026 Astronomy Image Explorer. All Rights Reserved.
