

Image Details
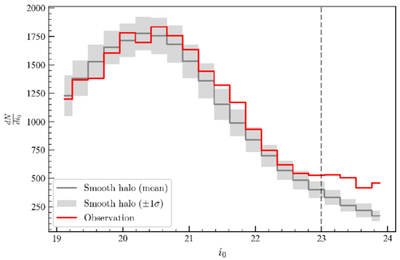
Caption: Figure 4.
Luminosity functions for the smooth-halo model and the observed halo. The gray histogram shows the mean luminosity function predicted by the smooth-halo model for the north field, based on the structural parameters derived in Paper II. The gray-shaded region represents the corresponding 1σ uncertainty propagated from the uncertainties in those structural parameters. The red histogram shows the luminosity function for the observed halo stars. The number counts are normalized in the i-band magnitude range of 19–21. This figure shows an observed excess at faint magnitudes (i0 ≳ 23) compared to the smooth-halo component, indicating the presence of new substructure.
Other Images in This Article
Copyright and Terms & Conditions
© 2026. The Author(s). Published by the American Astronomical Society.

