

Image Details
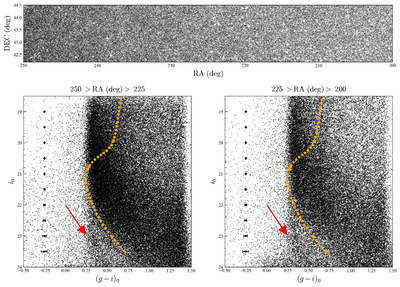
Caption: Figure 2.
Halo stars toward the north field. The upper panel shows the spatial distribution of halo stars in equatorial coordinates, while the two lower panels show the color–magnitude diagrams in a fixed range of decl. (from 42.5 to 44.5 deg) and two ranges of R.A. (left: from 225 to 250 deg; right: from 200 to 250 deg). The orange dotted line in each panel represents an isochrone with age of 11.5 Gyr, metallicity of −1.6, and assumed distance from the Sun of 30 kpc. The black dots with error bars show typical photometric uncertainties as a function of i0. This figure indicates that substructure exists in the stellar halo beyond 30 kpc, as indicated by the red arrow, and extends over at least 100 deg2.
Other Images in This Article
Copyright and Terms & Conditions
© 2026. The Author(s). Published by the American Astronomical Society.

