

Image Details
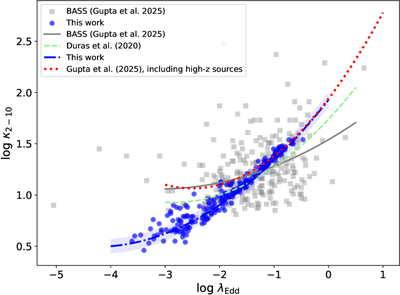
Caption: Figure 4.
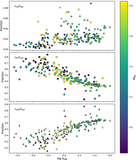
Blue circles and gray squares represent the variation of the X-ray bolometric correction (κ2−10) as a function of the Eddington ratio (λEdd) for the variable AGN studied here and for unobscured AGNs in BASS from K. K. Gupta et al. (2025), respectively. The blue dashed–dotted and orange solid lines represent the best fit for our sample (Equation (3)) and unobscured BAT AGNs (Equation (2) of K. K. Gupta et al. 2025), respectively. The red dotted line shows the best-fit relation of κ2−10−λEdd for unobscured BAT AGNs with high-redshift quasars, taken from K. K. Gupta et al. (2025). The green dashed line shows the κ2−10−λEdd relation from F. Duras et al. (2020). The blue shaded region represents the 1σ scatter from the present study.
Other Images in This Article
Copyright and Terms & Conditions
© 2026. The Author(s). Published by the American Astronomical Society.

