

Image Details
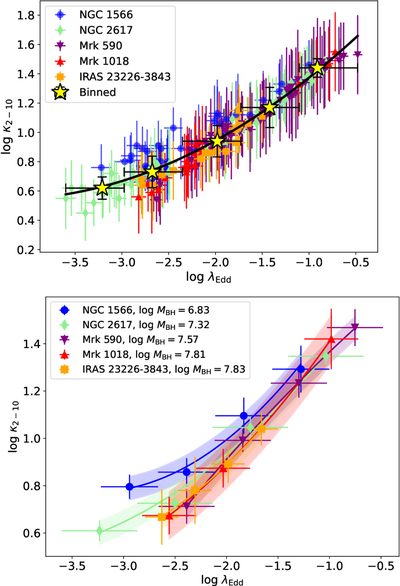
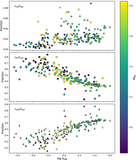
Caption: Figure 2.
Top panel: variation of X-ray bolometric correction (κ2−10) as a function of Eddington ratio (λEdd). The blue circles, green diamonds, purple down-triangles, red up-triangles, and orange squares represent the data points from NGC 1566, NGC 2617, Mrk 590, Mrk 1018, and IRAS 23226–3843, respectively. The yellow stars represent the binned data point. The black line represents the best fit (Equation (3)) to the data. Bottom panel: same as top panel but with median value in bins of ﹩\mathrm{log}{\lambda }_{{\rm{Edd}}}﹩. The shaded regions represent the 1σ scatter.
Other Images in This Article
Copyright and Terms & Conditions
© 2026. The Author(s). Published by the American Astronomical Society.

Copyright ©
2026 Astronomy Image Explorer. All Rights Reserved.
