

Image Details
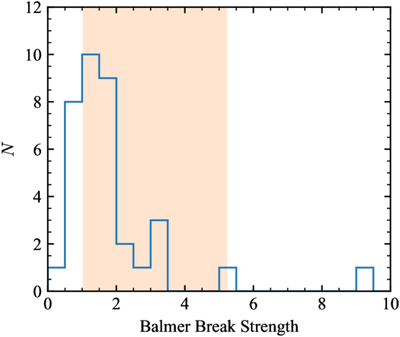
Caption: Figure 4.
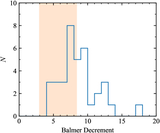
Distribution of Balmer break strengths in LRDs. The shaded region shows the expected range from the fiducial outflow model with M = 106 M⊙ and ﹩\dot{m}=2000﹩ given a covering factor from 0.1 (left side) to 0.8 (right side).
Other Images in This Article
Copyright and Terms & Conditions
© 2026. The Author(s). Published by the American Astronomical Society.

Copyright ©
2026 Astronomy Image Explorer. All Rights Reserved.
