

Image Details
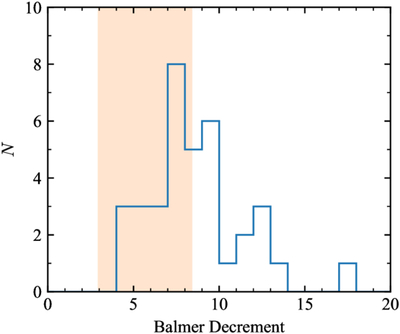
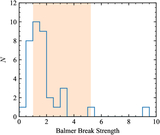
Caption: Figure 5.
Distribution of Balmer decrements in LRDs. The shaded region shows the expected range from the outflow model with M and ﹩\dot{m}﹩ determined from the observed luminosity and temperature for each object.
Other Images in This Article
Copyright and Terms & Conditions
© 2026. The Author(s). Published by the American Astronomical Society.

Copyright ©
2026 Astronomy Image Explorer. All Rights Reserved.
