

Image Details
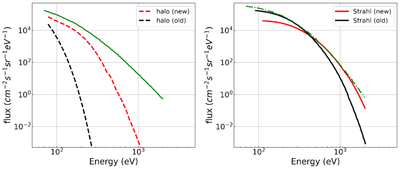
Caption: Figure 4.
Comparison of the energy spectrum of 0.1–1.5 keV halo (left) and strahl (right) electrons at 1 au. Observations from J. Tao et al. (2016) are depicted by the green solid (halo) and green dashed–dotted (strahl) lines. Red lines identify the coupled model (new), and black lines indicate the power-law-based model (old). The coupled model is a significant improvement of the halo spectrum over the old model, matching the observed slope from ∼102 to ∼3 × 10² eV, but it still lacks high-energy halo electrons. For the strahl, the coupled model yields κ ≈ 15, falling within the observed range of 8–16, whereas the old model gives κ ≈ 25.
Other Images in This Article
Copyright and Terms & Conditions
© 2026. The Author(s). Published by the American Astronomical Society.

