

Image Details
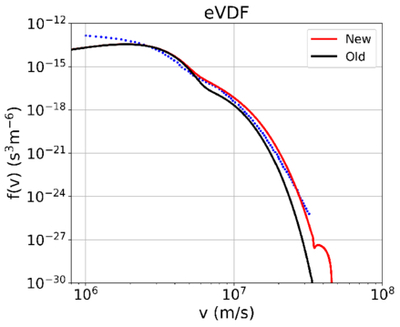
Caption: Figure 3.
Comparison of the new (red line) omnidirectional eVDFs f(v) at 1 au with observations (blue dotted line) and the old model (black line). The red and black lines are obtained by integrating the 2D contours over pitch-angle μ in the top right and bottom right figures in Figure 1, respectively. Both models reproduce the observed breakpoint at v ∼ 5 × 10⁶ m s−1 (∼70 eV). The coupled model yields a consistently higher suprathermal tail, indicating more abundant suprathermal electrons.
Other Images in This Article
Copyright and Terms & Conditions
© 2026. The Author(s). Published by the American Astronomical Society.

Copyright ©
2026 Astronomy Image Explorer. All Rights Reserved.
