

Image Details
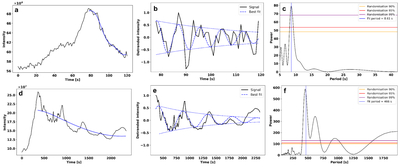
Caption: Figure 2.
Time-series analysis of the events illustrated in Figure 1. Panels (a)–(c) show the EUV brightening, and panels (d)–(f) show the solar flare. (a), (d) Example EUV light curves (black), with background trends derived using EMD (blue solid curves). (b), (e) Detrended signals composed of IMFs, together with the best-fitting damped harmonic oscillation models (blue dashed curves). (c), (f) Power spectra of the detrended signals. The vertical blue line marks the fitted period, while the purple, red, and yellow curves denote the 99%, 95%, and 90% confidence levels, respectively.
Other Images in This Article
Copyright and Terms & Conditions
© 2026. The Author(s). Published by the American Astronomical Society.

Copyright ©
2026 Astronomy Image Explorer. All Rights Reserved.
