

Image Details
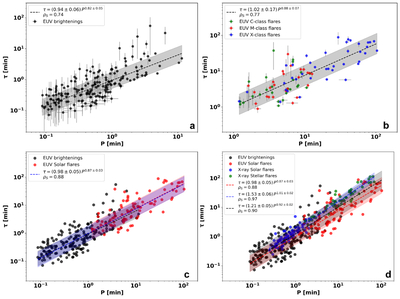
Caption: Figure 4.
Scaling relation between damping time (τ) and oscillation period (P). (a) EUV brightenings, (b) EUV solar flares, (c) the combined EUV events, and (d) the combined EUV data together with previously reported X-ray solar and stellar flares (I. H. Cho et al. 2016). Colored symbols denote different event classes as indicated in the legends. Dashed lines show the median posterior power-law relation inferred from Bayesian linear regression in log–log space. In panel (c), the black and red dashed lines correspond to fits obtained for EUV brightenings and EUV solar flares separately, while the blue dashed line shows the result of a single fit to the combined EUV dataset. In panel (d), the red and blue dashed lines represent fits to the EUV and X-ray event samples, respectively, and the black dashed line shows the fit obtained by combining all events. Shaded regions represent the intrinsic scatter associated with each regression. Spearman rank correlation coefficients (ρS) are reported in each panel.
Other Images in This Article
Copyright and Terms & Conditions
© 2026. The Author(s). Published by the American Astronomical Society.

