

Image Details
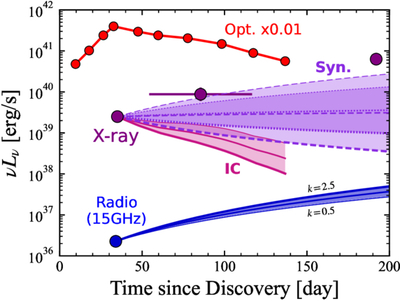
Caption: Figure 4.
Multiwavelength light curves of TDE2025aarm. The purple shaded regions represent the possible X-ray light curves predicted by our models. The dashed, dotted, and solid purple curves correspond to the synchrotron (slow- and fast-cooling) and IC scenarios, respectively. The width of each curve reflects the assumed slope of the CNM density profile, k = 0.5 (thin), 1.5 (medium), and 2.5 (thick). We also show the expected radio light curves at 15 GHz (blue), which lie in the self-absorbed regime, νLν ∝ n−1/4R2. The optical light curve (red) is taken from A. Simongini et al. (2026).
Other Images in This Article
Copyright and Terms & Conditions
© 2026. The Author(s). Published by the American Astronomical Society.

Copyright ©
2026 Astronomy Image Explorer. All Rights Reserved.
