

Image Details
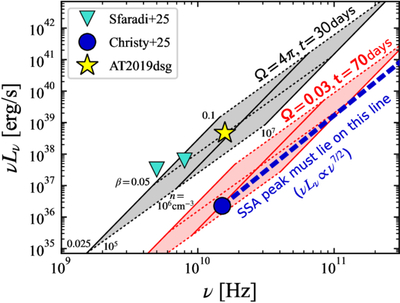
Caption: Figure 2.
The possible locations of the SSA peak marked as shaded regions, obtained for the CNM density n = 105−7 cm−3 and outflow velocity β = 0.025–0.1 (see Equations (2) and (3)). Other parameters are fixed to εe = 0.1, εB = 0.01, and p = 2.5. The solid lines depict the values for a constant density and varying velocity, while the dashed ones correspond to a constant velocity with varying density. The gray and pink regions correspond to opening angles of Ω = 4π and t = 30 days, and 0.03 and 70 days, respectively. The SSA peak of TDE2025aarm is expected to lie along the blue dashed line, which intersects the shaded regions only for a small opening angle. For comparison, the yellow star indicates the SSA peak of AT2019dsg at 42 days.
Other Images in This Article
Copyright and Terms & Conditions
© 2026. The Author(s). Published by the American Astronomical Society.

