

Image Details
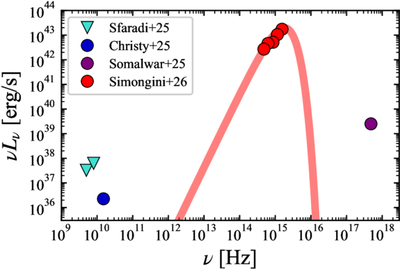
Caption: Figure 1.
The spectral energy distribution of TDE2025aarm at ≃30–40 days after the optical discovery. Radio upper limits are from I. Sfaradi et al. (2025), the 15 GHz detection from C. T. Christy et al. (2025), the optical data from A. Simongini et al. (2026), and the X-ray measurements from J. Somalwar et al. (2025). Inverted triangles indicate upper limits, while circles denote detections. The pink curve represents the optical blackbody spectrum with Topt = 22,000 K and Rph = 4 × 1014 cm (see A. Simongini et al. 2026).
Other Images in This Article
Copyright and Terms & Conditions
© 2026. The Author(s). Published by the American Astronomical Society.

Copyright ©
2026 Astronomy Image Explorer. All Rights Reserved.
