

Image Details
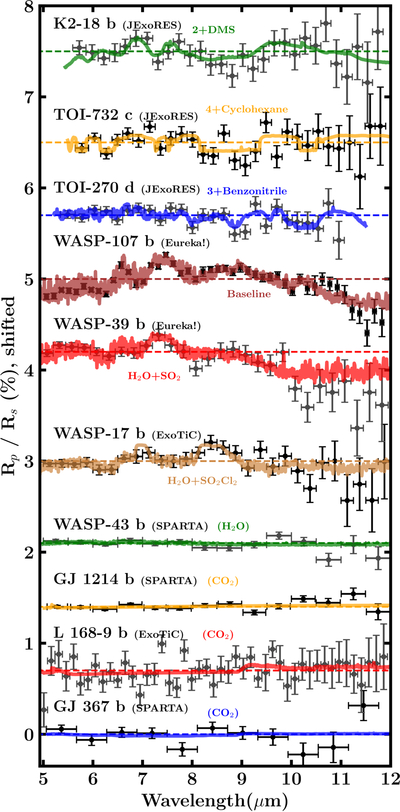
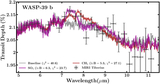
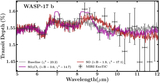
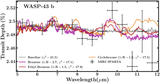
Caption: Figure 4.
JWST MIRI-LRS transmission spectra of all ten planets considered in this work. In black and gray are the data from the indicated reduction pipeline. In colored dashed lines are the mean transit depths, and in colored solid lines are the best-fit model spectra from the retrieval, including the molecule reaching the highest ﹩\mathrm{ln}{B}_{{\rm{\min }}}﹩ for this planet, if ﹩\mathrm{ln}{B}_{{\rm{\min }}}\,\geqslant \,2﹩ (see Section 4). When no molecule reaches this threshold, we display the baseline retrieval spectra, which are discussed in Section 3.2 and summarized in Appendix A. We write (H2O) or (CO2) when the molecule is weakly constrained. Each spectrum has been converted from transit depth ﹩{\left(\frac{{R}_{p}}{{R}_{\star }}\right)}^{2}﹩ into radius ratio ﹩\frac{{R}_{p}}{{R}_{\star }}﹩, as in Appendix C.
Other Images in This Article
Show More
Copyright and Terms & Conditions
© 2026. The Author(s). Published by the American Astronomical Society.

