

Image Details
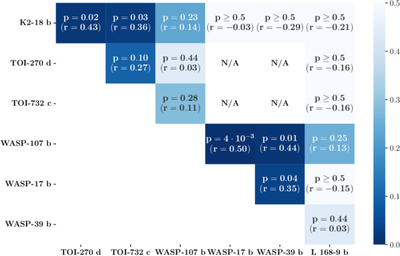
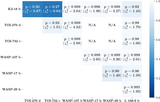
Caption: Figure 3.
Correlations between transmission spectra of different planets (see Section 2.2.4). Note that here the color map is linear between p = 0 and 0.5, because the p-values are higher than in Figure 2 (as expected for different planets). TOI-270 d and TOI-732 c cannot be compared with WASP-17 b and WASP-39 b because of the different wavelength binning.
Other Images in This Article
Show More
Copyright and Terms & Conditions
© 2026. The Author(s). Published by the American Astronomical Society.

Copyright ©
2026 Astronomy Image Explorer. All Rights Reserved.
