

Image Details
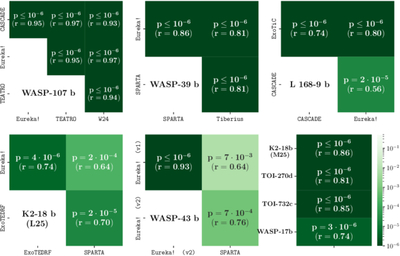
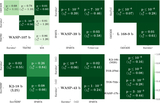
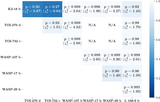
Caption: Figure 2.
Correlations between different data reductions of the same transmission spectrum observed for each planet (see Section 2.2.3). We use all the spectra from Table 2 and Appendix B. For each pair of spectra compared, we show the p-value, which defines the log-linear color map, and the Pearson coefficient r below. Each of the first five heat maps corresponds to a single planet, and the last one shows the correlations between the only two available reductions of the four planets listed. For K2-18 b, the spectra from N. Madhusudhan et al. (2025a), shown as M25, cannot be compared with those of R. Luque et al. (2025), shown as L25, because of the different wavelength binning.
Other Images in This Article
Show More
Copyright and Terms & Conditions
© 2026. The Author(s). Published by the American Astronomical Society.

