

Image Details
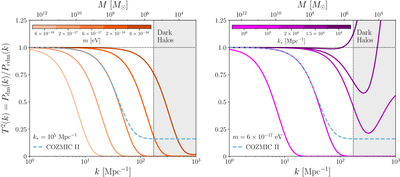
Caption: Figure 1.
Ratio of the linear matter power spectrum for our scenario, in which DM production imprints a free-streaming cutoff and a Poisson enhancement, versus that in CDM. The left panel shows transfer functions at a fixed k* = 105 Mpc−1 for five values of m (with m increasing from the lightest to darkest shade); the right panel shows fixed m = 6 × 10⁻¹⁷ eV for five values of k* (with k* decreasing from the lightest to darkest shade). The dashed blue line shows the square of the COZMIC II transfer function with a 40% plateau height, which is ruled out at 95% confidence by the MW satellite population (R. An et al. 2025); ultralight DM models with power spectra that are strictly more suppressed than this reference for k < 172 Mpc−1 are ruled out. The dotted black vertical line marks k = 172 Mpc−1; larger wavenumbers in the shaded gray region correspond to halo masses below the galaxy formation threshold in the presence of molecular hydrogen cooling and DM–baryon streaming motion (E. O. Nadler 2025).
Other Images in This Article
Copyright and Terms & Conditions
© 2026. The Author(s). Published by the American Astronomical Society.

