

Image Details
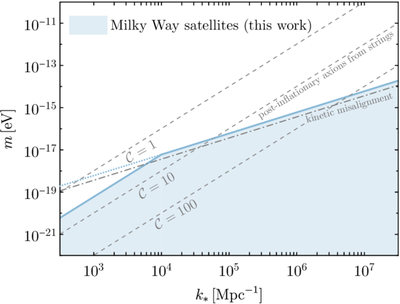
Caption: Figure 2.
Limits on the DM particle mass, m, versus the comoving wavenumber of field modes that dominate the DM density, k*, based on DES and PS1 MW satellite observations (solid blue line; the shaded region is excluded). The dotted line shows an extrapolation of the m ∼ k* scaling to lower k* as a visual guide; for k* < 104 Mpc−1, the scaling of our mass bound steepens to ﹩m\sim {k}_{* }^{2}﹩ (see the main text for details). Gray curves show representative theoretical relationships between m and k* motivated by the production mechanisms discussed at the end of Section 3.
Other Images in This Article
Copyright and Terms & Conditions
© 2026. The Author(s). Published by the American Astronomical Society.

Copyright ©
2026 Astronomy Image Explorer. All Rights Reserved.
