

Image Details
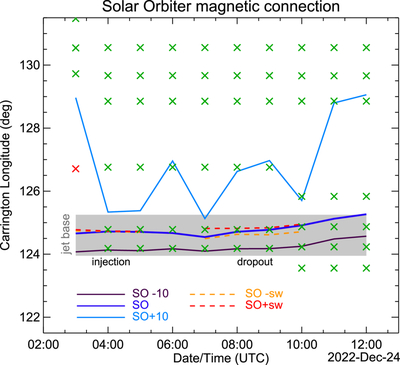
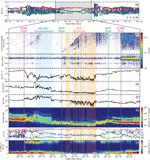
Caption: Figure 4.
Carrington longitude of Solar Orbiter photospheric footpoints versus time. Solid curves show SO, SO−10, and SO+10. Dashed curves SO−sw and SO+sw show the longitude uncertainty from measured vsw variability during the injection (03:00–05:00 UT) and dropout (07:00–10:00 UT) intervals. The × symbols mark photospheric footpoints of open-to-ecliptic field lines (∣λSS∣≤7°), colored by polarity (green for positive, red for negative). Photospheric footpoints whose source-surface endpoints lie at other latitudes (shown in Figure 3) are omitted for clarity. The gray band denotes the EUV jet-base longitude range.
Other Images in This Article
Copyright and Terms & Conditions
© 2026. The Author(s). Published by the American Astronomical Society.

