

Image Details
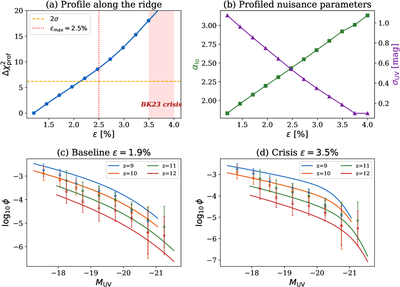
Caption: Figure 3.
Validation of the profile likelihood. (a) ﹩{\rm{\Delta }}{\chi }_{{\rm{prof}}}^{2}﹩ along the ridge; the 2σ boundary is crossed at ﹩{\varepsilon }_{{\rm{\max }}}=2.5 \% ﹩. (b) Profiled nuisance parameters: at high f⋆,0, the optimizer steepens αlo and compresses σUV. (c) UVLF model versus data at baseline (ε = 1.9%). (d) At the crisis threshold (ε = 3.5%, Δχ2 = 13.4): the UVLF shape is visibly distorted. The log-normal model gives Δχ2 = 11.8 (3.4σ); the duty-cycle model gives Δχ2 = 20.2 (4.5σ).
Other Images in This Article
Copyright and Terms & Conditions
© 2026. The Author(s). Published by the American Astronomical Society.

Copyright ©
2026 Astronomy Image Explorer. All Rights Reserved.
