

Image Details
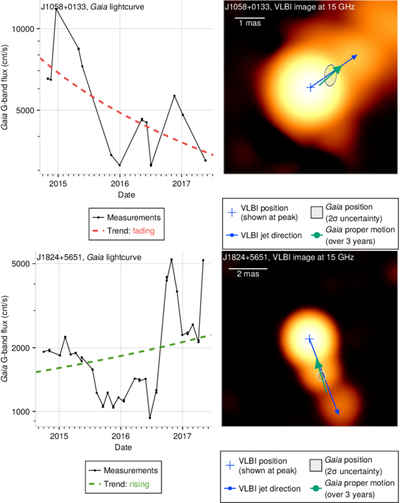
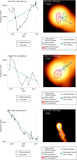
Caption: Figure 3.
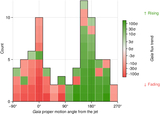
Two example blazars illustrating how flux variability drives centroid motion. Top: J1058+0133—fading flux, proper motion downstream along the jet (0° in Figure 4). Bottom: J1824+5651—rising flux, proper motion upstream (180° in Figure 4). Left panels: Gaia DR3 light curve with the linear trend in inverse flux (see Section 3.1). Colors match those in Figure 4. Right panels: VLBI image at 15 GHz, Gaia position relative to the VLBI position, and Gaia proper motion vector.
Other Images in This Article
Copyright and Terms & Conditions
© 2026. The Author(s). Published by the American Astronomical Society.

Copyright ©
2026 Astronomy Image Explorer. All Rights Reserved.
