

Image Details
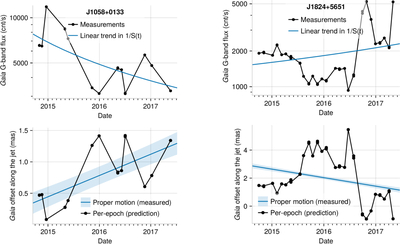
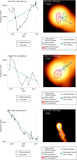
Caption: Figure 7.
Predicted per-epoch centroid positions for J1058+0133 (left) and J1824+5651 (right), illustrating the signal expected from Gaia DR4 per-epoch astrometry. Top: Gaia light curves analogous to the left panels of Figure 3, with the linear trend in inverse flux. Bottom panels: centroid position along the jet predicted at each photometric epoch (black points) compared with the DR3 linear proper motion (blue line). The epoch-by-epoch excursions—driven by flux variability—illustrate the underlying signal that DR4 per-epoch astrometry will probe. Uncertainties of individual Gaia measurements are expected to be comparable to these excursions, implying that the correlation signal will only be visible in the aggregate.
Other Images in This Article
Copyright and Terms & Conditions
© 2026. The Author(s). Published by the American Astronomical Society.

