

Image Details
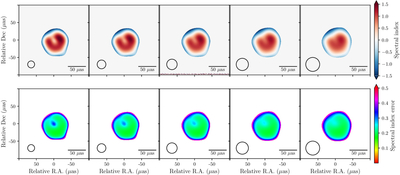
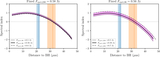
Caption: Figure 4.
Spectral-index maps (top row) and their corresponding error distributions (bottom row) derived from the GMVA 2018 3.5 mm and EHT 2018 1.3 mm images. Columns show results for different circular Gaussian beam sizes (FWHM = 20, 25, 30, 35, and 40 μas), with the beam illustrated as a circle in the lower-left corner of each panel. All maps are masked to include only pixels where the intensity in both bands exceeds 3σrmsν.
Other Images in This Article
Copyright and Terms & Conditions
© 2026. The Author(s). Published by the American Astronomical Society.

Copyright ©
2026 Astronomy Image Explorer. All Rights Reserved.
