

Image Details
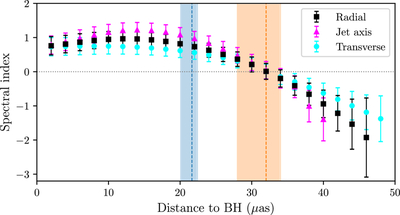
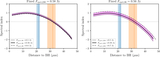
Caption: Figure 2.
Radial spectral-index profiles derived from the 86 and 230 GHz images. The black curve shows the azimuthally averaged profile, while the magenta and cyan curves represent profiles extracted along the jet axis (PA = 288∘) and the transverse direction (PA = 18∘), respectively. Vertical orange and blue lines indicate the characteristic ring radii at 86 GHz (﹩3{2}_{-4}^{+2},\mu ﹩as) and 230 GHz (﹩21.{7}_{-1.6}^{+0.8},\mu ﹩as), with shaded bands showing uncertainties. The horizontal dotted line marks α = 0.
Other Images in This Article
Copyright and Terms & Conditions
© 2026. The Author(s). Published by the American Astronomical Society.

Copyright ©
2026 Astronomy Image Explorer. All Rights Reserved.
