

Image Details
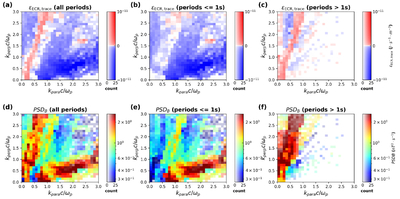
Caption: Figure 3.
Distributions of energy conversion rate and magnetic fluctuation energy in wavevector space. Each panel includes a count-to-opacity mapping: bins with a count exceeding 25 are rendered fully opaque to reduce the impact of a small number of outliers. This threshold is used for visualization only, and the qualitative angular separation remains unchanged for nearby threshold choices. (a)–(c) Distributions of the energy conversion rate in the k∥–k⊥ space for all timescales, small scales (0.2–1 s), and large scales (1–2 s). (d)–(f) Corresponding distributions of magnetic fluctuation energy for the same scale ranges. The absolute magnitudes of reconstructed k∥ and k⊥ should be interpreted with caution, whereas the directional separation is robust.
Other Images in This Article
Copyright and Terms & Conditions
© 2026. The Author(s). Published by the American Astronomical Society.

