

Image Details
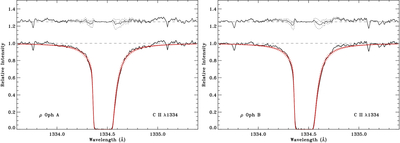
Caption: Figure 3.
Normalized spectra of the interstellar C II λ1334 line toward ρ Oph A (left panel) and ρ Oph B (right panel). The solid red line in each panel indicates the best-fitting Voigt profile. The dotted red lines correspond to the ±1σ range in the derived column density due to statistical uncertainties. The fit residuals are plotted above each spectrum.
Other Images in This Article
Copyright and Terms & Conditions
© 2026. The Author(s). Published by the American Astronomical Society.

Copyright ©
2026 Astronomy Image Explorer. All Rights Reserved.
