

Image Details
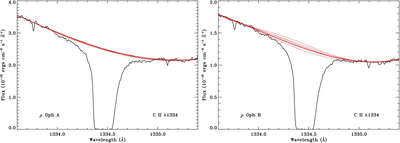
Caption: Figure 2.
High-resolution HST/STIS spectra in the vicinity of the interstellar C II λ1334 line toward ρ Oph A (left panel) and ρ Oph B (right panel). The thick red line in each panel indicates the adopted continuum fit. The thinner red lines demonstrate the range of plausible continuum fits used to determine the effect of continuum placement on the derived column density. (The two weak and narrow absorption features on either side of the C II line are due to vibrationally excited H2.)
Other Images in This Article
Copyright and Terms & Conditions
© 2026. The Author(s). Published by the American Astronomical Society.

Copyright ©
2026 Astronomy Image Explorer. All Rights Reserved.
