

Image Details
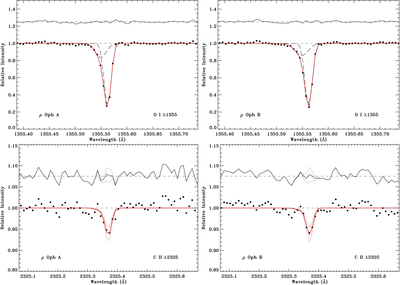
Caption: Figure 1.
Profile synthesis fits to the O I λ1355 and C II λ2325 lines toward ρ Oph A (left panels) and ρ Oph B (right panels). The data points represent the observed spectra, while the synthetic profiles are shown by the solid red lines. The dashed curves in the upper panels indicate the results for the two individual velocity components obtained from the fits to the O I lines. The dotted red curves in the lower panels correspond to the ±1σ range in the derived C II column densities. The fit residuals are plotted above each spectrum. The same range in velocity is shown in each panel.
Other Images in This Article
Copyright and Terms & Conditions
© 2026. The Author(s). Published by the American Astronomical Society.

Copyright ©
2026 Astronomy Image Explorer. All Rights Reserved.
