

Image Details
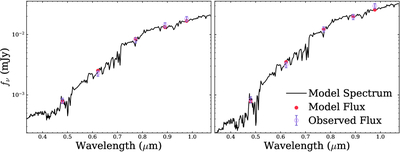
Caption: Figure 3.
CIGALE SED fitting results for the two lens galaxies. The black curves show the best-fitting model spectra, the red points show the model fluxes integrated through the HSC filters, and the open purple points show the observed lens photometry used in the fit.
Other Images in This Article
Copyright and Terms & Conditions
© 2026. The Author(s). Published by the American Astronomical Society.

Copyright ©
2026 Astronomy Image Explorer. All Rights Reserved.
