

Image Details
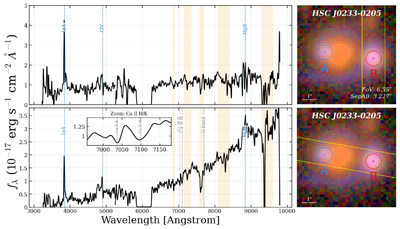
Caption: Figure 1.
P200/DBSP spectroscopy of HSC J0233−0205. The right panels show the HSC color image of the system, with the two multiple images labeled A and B. North is up, and east is to the left. The lower-right panel shows the slit position used for the spectroscopic observation. The left panels show the extracted one-dimensional spectra of image B (top) and the foreground lens galaxies plus image A (bottom). The blue dashed lines mark emission lines from the lensed source at zs = 2.160, including Lyα, C IV, and Mg II. The gray dashed lines in the lower panel indicate absorption features associated with the lens galaxies at zd = 0.790, including Ca II H/K and the G band; the inset shows a zoom-in around the Ca II H/K absorption doublet. The orange shaded bands mark major telluric absorption regions.
Other Images in This Article
Copyright and Terms & Conditions
© 2026. The Author(s). Published by the American Astronomical Society.

