

Image Details
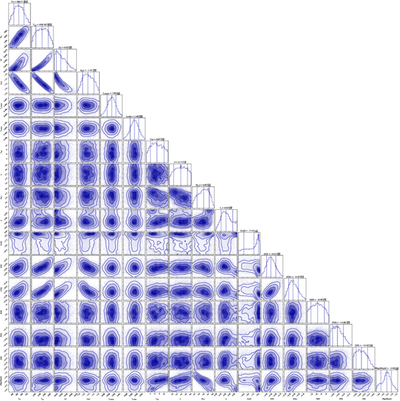
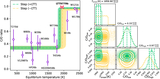
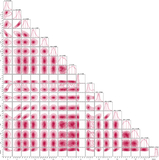
Caption: Figure A3.
Corner plot showing the posterior distributions from the free chemistry retrievals of the exoTEDRF spectrum using the Guillot P–T profile, including only the well-constrained molecular species.
Other Images in This Article
Copyright and Terms & Conditions
© 2026. The Author(s). Published by the American Astronomical Society.

Copyright ©
2026 Astronomy Image Explorer. All Rights Reserved.
