

Image Details
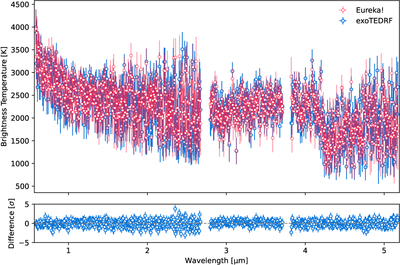
Caption: Figure 2.
Observed panchromatic emission spectra of LTT9779b—combining NIRISS and NIRSpec/G395H observations—shown in terms of brightness temperature (top panel), derived from two independent reductions of the raw data using Eureka! (red) and exoTEDRF (blue), followed by modeling of the binned spectroscopic light curves. The mean absolute difference between the two spectra is ∼0.6σ (bottom panel), indicating excellent statistical agreement.
Other Images in This Article
Copyright and Terms & Conditions
© 2026. The Author(s). Published by the American Astronomical Society.

Copyright ©
2026 Astronomy Image Explorer. All Rights Reserved.
