

Image Details
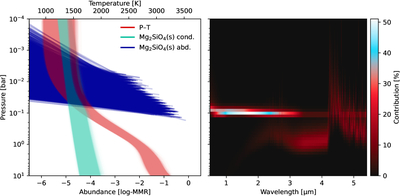
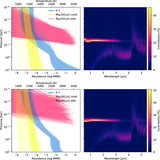
Caption: Figure A4.
Retrieved posterior P–T profiles from the free chemistry retrievals of the exoTEDRF spectrum, shown along with the corresponding posteriors for Mg2SiO4(s) condensation curves and abundance profiles, plus the median contribution functions.
Other Images in This Article
Copyright and Terms & Conditions
© 2026. The Author(s). Published by the American Astronomical Society.

Copyright ©
2026 Astronomy Image Explorer. All Rights Reserved.
