

Image Details
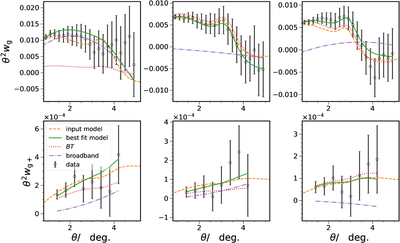
Caption: Figure 4.
The density (upper panels) and GI (lower panels) correlation functions for the first three tomographic bins (left to right) are shown. We compare the measurements (data points, black) with the joint density-GI BAO best-fit model (solid line, green). Shown also are the components of the best-fit model, including the input template model (dashed line, orange), BT term (dotted ine, red), and broadband term (dotted–dashed line, violet).
Other Images in This Article
Copyright and Terms & Conditions
© 2026. The Author(s). Published by the American Astronomical Society.

Copyright ©
2026 Astronomy Image Explorer. All Rights Reserved.
