

Image Details
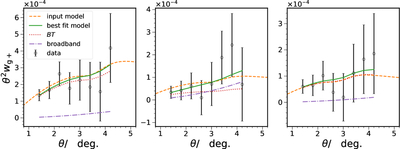
Caption: Figure 2.
Shown are the GI correlation function measurements (data points, black) and its best-fit model (solid line, green) for the first three tomographic bins (from left to right). We also plot the components of the best-fit model, including the input template model (dashed line, orange), BT term (dotted line, red), and broadband term (dotted–dashed line, violet).
Other Images in This Article
Copyright and Terms & Conditions
© 2026. The Author(s). Published by the American Astronomical Society.

Copyright ©
2026 Astronomy Image Explorer. All Rights Reserved.
