

Image Details
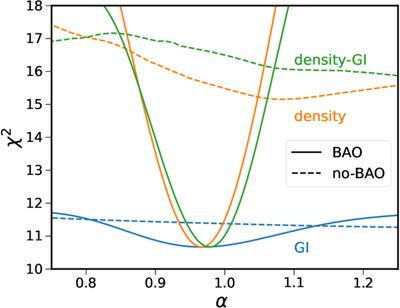
Caption: Figure 3.
χ2 distribution as a function of α, obtained with the BAO (solid) and no-BAO (dashed) model, respectively. The GI (blue), density (orange), and joint density-GI (green) BAO fit results are compared. For ease of comparison, the χ2 distributions for the density and GI-density are shifted vertically so that their BAO template results are of the same height as the GI one.
Other Images in This Article
Copyright and Terms & Conditions
© 2026. The Author(s). Published by the American Astronomical Society.

Copyright ©
2026 Astronomy Image Explorer. All Rights Reserved.
