

Image Details
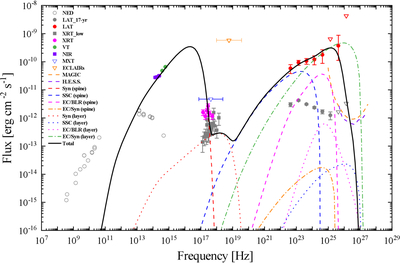
Caption: Figure 6.
Observed SED with model fitting for PKS 1725+123 in the high-flux state. The three near-infrared points (purple filled squares) taken from L. Carrasco et al. (2025), the average flux (two green filled circles) from the consecutive four-orbit SVOM-VT observations on 2025 August 20–21, the average spectrum from two Swift-XRT observations (magenta filled circles) on 2025 August 19 and 21 (shaded region in Figure 4), the weighted-average 3σ upper limit of the flux observed by SVOM-MXT (blue open inverted triangle) and SVOM-ECLAIRs (orange open inverted triangle), and the Fermi-LAT time-resolved spectrum (red filled circles and open inverted triangle) from 2025 August 16–18 collectively constitute the SED of the source in the high-flux state. The black solid line (including EBL absorption) represents the total emission model, including synchrotron radiation (red lines), the SSC process (blue lines), and the EC/BLR process (magenta lines), where the dashed and dotted lines denote emission from the spine and sheath regions, respectively. The green dashed–dotted line indicates the IC component (without EBL absorption) of the synchrotron photons in the spine zone by the relativistic electrons in the sheath region, while the flux contribution from the opposite process is depicted as the orange dashed–dotted line. For comparison, the NED archived radio–optical data (gray open circles), the average spectrum (gray filled squares) from the first three Swift-XRT observations (left panels in Figure 4), and the 17 yr Fermi-LAT integrated spectrum (gray filled circles and open inverted triangles) are presented. The sensitivity curves of the MAGIC telescopes (orange dashed line; 50 hr) and H.E.S.S. (purple dashed line; 50 hr) are also given in the figure.
Other Images in This Article
Copyright and Terms & Conditions
© 2026. The Author(s). Published by the American Astronomical Society.

