

Image Details
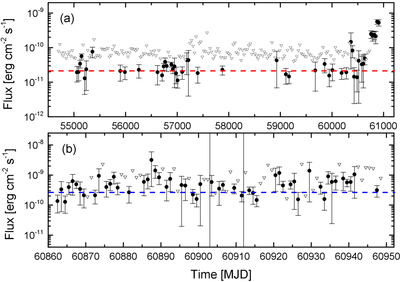
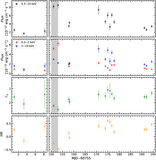
Caption: Figure 7.
Light curves of PKS 1725+123 observed by Fermi-LAT in the 0.1–1000 GeV band. If TS < 9, an upper limit (represented by open inverted triangles) is provided for that time bin. Panel (a): the 17 yr long-term light curve, derived with a time bin of 30 days. The red horizontal dashed line denotes the ∼17 yr average flux, i.e., F0.1−1000 GeV = (2.12 ± 0.10) × 10−11 erg cm−2 s−1. Panel (b): the 3 month light curve with a time bin of 1 day, covering the period from 2025 July 6 to 2025 October 1. The blue horizontal dashed line denotes the weighted average flux of 2.65 × 10⁻¹⁰ erg cm−2 s−1, which is derived using Equation (1). The two black vertical lines represent the capture time interval of the three time-resolved spectra in Figure 5.
Other Images in This Article
Copyright and Terms & Conditions
© 2026. The Author(s). Published by the American Astronomical Society.

