

Image Details
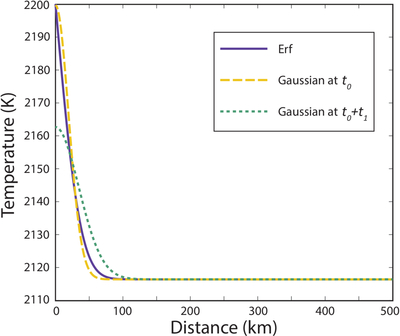
Caption: Figure 5.
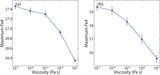
Comparison between the error function result at the base of the model (based on the error function) and the Gaussian approximation described in the text. No adiabat is included. Note that at t0 the total error (the integrated absolute difference between the curves) is maximum. The temperature anomaly evolves as the upwelling ascends while diffusion takes place (e.g., t0 + t1).
Other Images in This Article
Copyright and Terms & Conditions
© 2026. The Author(s). Published by the American Astronomical Society.

Copyright ©
2026 Astronomy Image Explorer. All Rights Reserved.
